Report Card
NY4P’s Report Card series is the only independent comparative survey of park maintenance across all five boroughs. The reports analyze conditions of individual parks and beaches, and offer system-wide suggestions that are routinely used by the New York City Department of Parks and Recreation in targeting maintenance investment and identifying citywide needs. Following publication of each report, NY4P conducts outreach in the communities with the poorest-performing parks and beaches to better understand existing problems and work with local stakeholders and the Parks Department on solutions.
Report Card on Parks
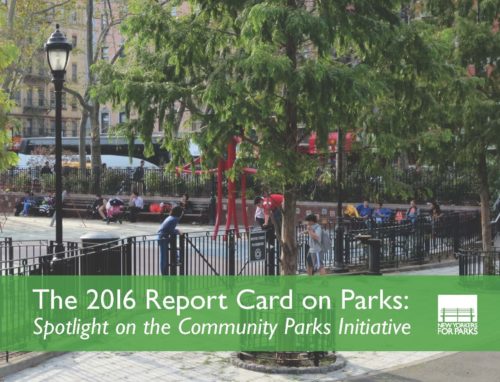
2016 Report Card on Parks: Spotlight on the Community Parks Initiative
The 2016 Report Card on Parks: Spotlight on the Community Parks Initiative assesses "neighborhood parks" within Community Parks Initiative zones. These parks are larger than those targeted by CPI, and many of them are in need of real renewal and reconstruction. Some parks that are very popular and heavily-used performed poorly due to lack of adequate maintenance. Parks that had been renovated or constructed most recently scored higher than their older counterparts.
2013: Report Card on Large Parks
The 2012 Report Card on Large Parks report revisits maintenance conditions of the 43 parks between 20 and 500 acres surveyed in our 2011 Report Card on Large Parks. While 88 percent of parks scored in the A or B range, the report makes clear that the Parks Department simply hasn’t had sufficient resources to keep up with the maintenance demands of 29,000 acres of parkland.
2011 Report Card on Large Parks
Our first Report Card on Large Parks assessed the conditions of 45 parks between 20 and 500 acres. The good news: the vast majority scored an A or B, and only one park received a failing grade.
2010: Artificial Turf: A Report Card on Parks Project
Artificial Turf: A Report Card on Parks Project examined the conditions of artificial turf fields in parks less than 40 acres in the summers of 2008 and 2009. Overall, conditions fell from a B- to a C- over that duration, but litter on the fields and trash bin containment both improved substantially.
2008 Report Card on Parks: Spotlight on Recreation
The 2008 Report Card on Parks: Spotlight on Recreation assessed the conditions of three outdoor recreation features – athletic fields, courts, and playgrounds – in a random selection of 49 neighborhood parks. Each feature was inspected on three separate site visits, once each in June, July, and August. The report documented generally subpar conditions throughout the course of the summer.
2007 Report Card on Parks
This 2007 Report Card on Parks surveyed 111 properties from the Parks Department’s Parks Inspection Program roster, and found that inadequate care remained a challenge. The majority of parks – 39% of those surveyed – received “C” grades. 16% of parks received “D”s and 22% received “F”s.
2006 Progress Report on Neighborhood Parks
In the Progress Report on Neighborhood Parks we revisited the parks from our 2003, 2004 and 2005 reports in 2006. The primary finding was that the lowest-scoring parks from the previous year – the ten parks that received “F’s,” retained failing grades. And none of those parks had received capital funding for at least eight years.
2005 Mini Report Card on Parks: Spotlight on NYC’s Athletic Fields, Bathrooms and Drinking Fountains
In the 2005 Mini Report Card on Parks we returned to the same 200 parks featured in our 2004 and 2003 reports in order to track the progress of of several perennially poor performers over the course of the summer. On average, bathroom scores rose from a “D: to a “C+” but scores for drinking fountains and athletic fields remained in the “F” range for all three months. Overall, the Parks Department responded to key Report Card findings between 2003 and 2005, including the recurring issue of locked park bathrooms, and subsequently, the average grade for these 200 parks improved.
2005 Report Card on Parks
In the 2005 Report Card on Parks we surveyed 109 park properties. Although neighborhood parks showed important improvements this year, these smaller, low-profile parks are in need of greater investment – too many park grades fluctuate with sporadic maintenance. In three years of data collection, there was little change among the lowest-performing parks, and certain service areas continue to perform poorly across the board.
2004: Report Card on Parks
Our second Report Card on Parks illustrated just how greatly neighborhood parks are influenced by maintenance work — enough to significantly change their score from one year to the next. Many parks surveyed in 2003 slipped or improved based solely on the level of maintenance work performed, illustrating how critical maintenance is to neighborhood parks.
2003 Report Card on Parks
In our inaugural Report Card on Parks, we surveyed 181 neighborhood parks between one and 20 acres. Results were mixed: forty-three of the 181 parks surveyed received a grade of A or better, while 69 received a grade of D or F.
Report Card on Beaches
2015: Report Card on Beaches
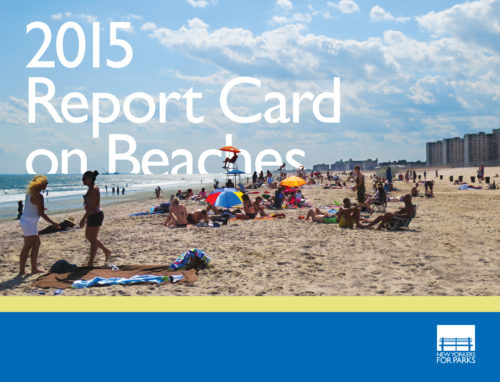
The first assessment of New York City-owned beaches since Hurricane Sandy, the 2015 Report Card on Beaches finds overall progress with wide variations in beach quality. It adds Cedar Grove Beach on Staten Island to the study inventory and issues six recommendations to make all city beaches world-class.
2011: Report Card on Beaches
The 2011 Report Card on Beaches, the third in our series, looked at the seven municipal swimming beaches with an eye toward trends across the six years. The average beach score increased from an F in 2007 to a B+ in 2011.
2009: Report Card on Beaches
In the The 2009 Report Card on Beaches the city’s public swimming beaches showed moderate improvement from the 2007 Report Card on Beaches to the 2009 report, in which three beaches were rated “Satisfactory” versus only one in 2007. However, four out of seven properties were rated “Challenged” or “Unsatisfactory,” showing that the City’s beaches still lack sufficient care.
2007 Report Card on Beaches
Our first Report Card on Beaches documented largely poor conditions. In particular, many drinking fountains and shorelines received failing grades, and more beaches received a rating of “Challenged” than any other rating.
Featured Data and Research
The 2016 Report Card on Parks
Spotlight on Community Parks Initiative zones.

The 2015 Report Card on Beaches
The first assessment of beaches since Hurricane Sandy finds overall progress with wide variations in beach quality, and issues six recommendations.